Home Price Trends
Introduction
The CoreLogic Home Price Insights report features an interactive view of our Home Price Index product with analysis through January 2020 with forecasts from February 2020.
CoreLogic HPI™ is designed to provide an early indication of home price trends. The indexes are fully revised with each release and employ techniques to signal turning points sooner. CoreLogic HPI Forecasts™ (with a 30-year forecast horizon), project CoreLogic HPI levels for two tiers—Single-Family Combined (both Attached and Detached) and Single-Family Combined excluding distressed sales.
The report is published monthly with coverage at the national, state and Core Based Statistical Area (CBSA)/Metro level and includes home price indices (including distressed sale); home price forecast and market condition indicators. The data incorporates more than 40 years of repeat-sales transactions for analyzing home price trends.
HPI National Change
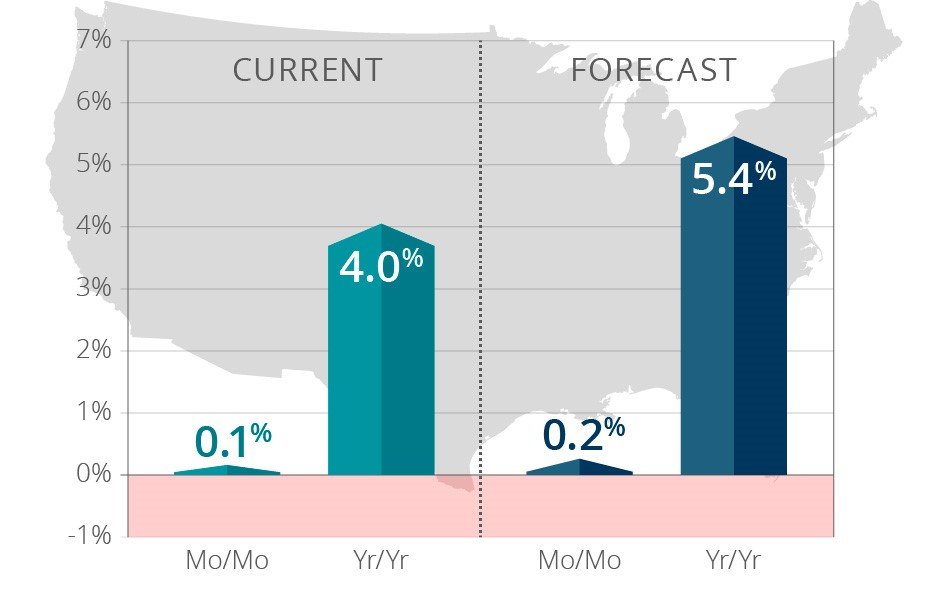
January 2020 National Home Prices
Home prices nationwide, including distressed sales, increased year over year by 4% in January 2020 compared with January 2019 and increased month over month by 0.1% in January 2020 compared with December 2019 (revisions with public records data are standard, and to ensure accuracy, CoreLogic incorporates the newly released public data to provide updated results).
Forecast Prices Nationally
The CoreLogic HPI Forecast indicates that home prices will increase by 5.4% on a year-over-year basis from January 2020 to January 2021. On a month-over-month basis, home prices are expected to increase by 0.2% from January 2020 to February 2020. The CoreLogic HPI Forecast is a projection of home prices using the CoreLogic HPI and other economic variables. Values are derived from state-level forecasts by weighting indices according to the number of owner-occupied households for each state.
“January marked the third consecutive month that annual home price growth accelerated in our national index, as low mortgage rates and rising income supported home sales. In February, mortgage rates fell to the lowest level in more than three years, which likely will spur additional home shopping activity and price appreciation.”
– Dr.
Frank Nothaft
Chief Economist for CoreLogic
HPI & Case-Shiller Trends
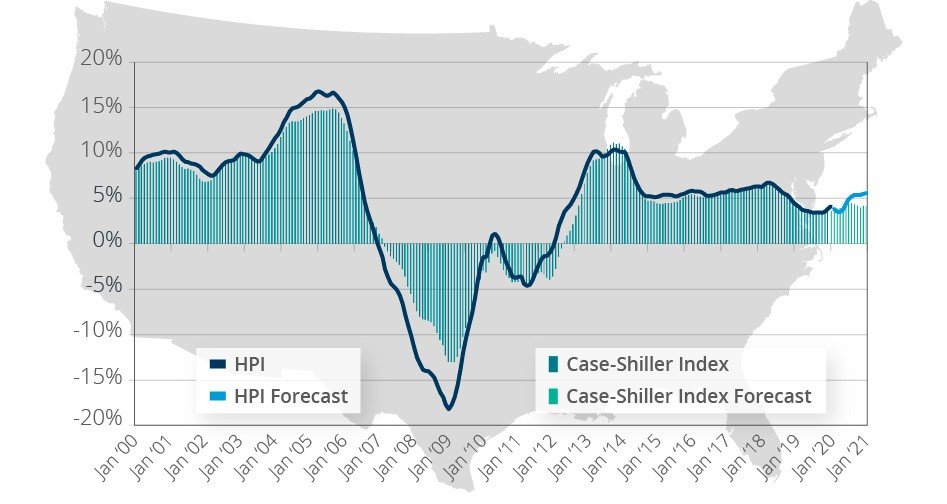
This graph shows a comparison of the national year-over-year percent change for the CoreLogic HPI and CoreLogic Case-Shiller Index from 2000 to present month with forecasts one year into the future. We note that both the CoreLogic HPI Single Family Combined tier and the CoreLogic Case-Shiller Index are posting positive, but moderating year-over-year percent changes, and forecasting gains for the next year.
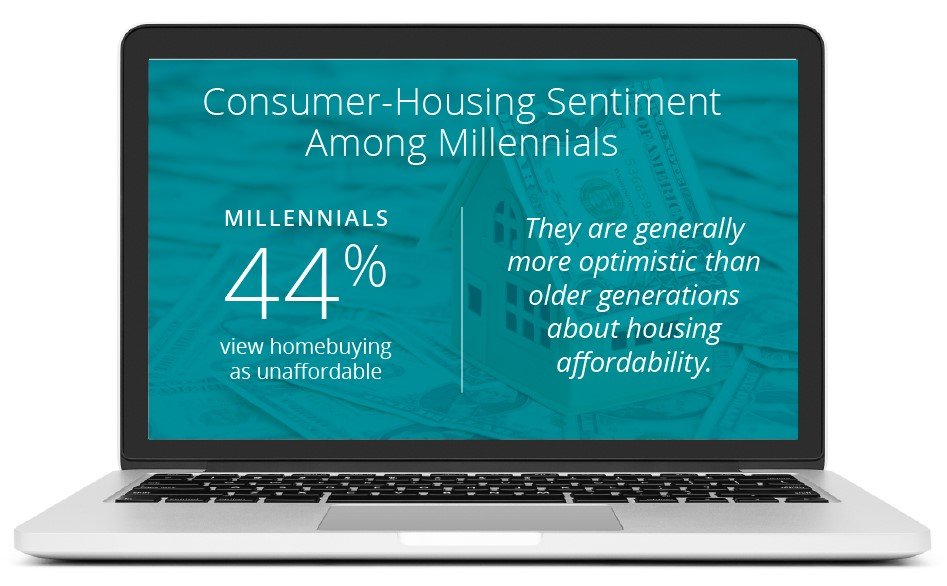
2019 CoreLogic Consumer Housing Sentiment Study
During the second quarter of 2019, CoreLogic, together with RTi Research of Norwalk, Connecticut, conducted an extensive survey measuring consumer-housing sentiment among millennials. While nearly half (44%) of millennials view homebuying as unaffordable, they are generally more optimistic than older generations about housing affordability. However, older generations are less concerned with home prices impacting personal finances and feel more comfortable handling monthly payments than millennials.
“Despite a slowdown in home price growth last summer, annual appreciation is beginning to stabilize. While just under half of millennials feel confident they can afford to purchase a home, housing starts have shot up, and mortgage rates have come down, which has helped improve affordability and spur overall housing demand.”
-Frank
Martell
President and CEO of CoreLogic
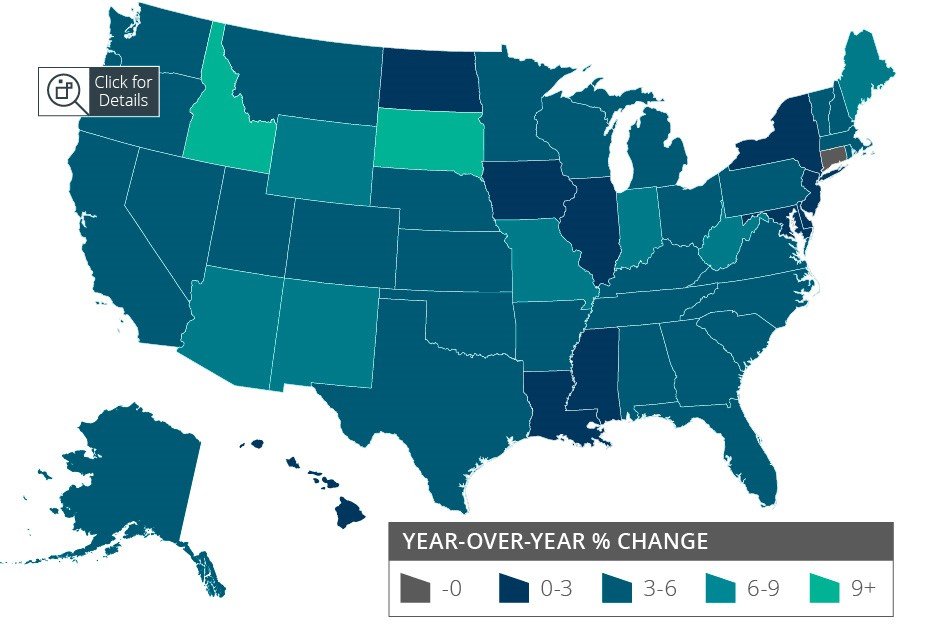
HPI National and State Maps – January 2020
The CoreLogic HPI provides measures for multiple market segments, referred to as tiers, based on property type, price, time between sales, loan type (conforming vs. non-conforming) and distressed sales. Broad national coverage is available from the national level down to ZIP Code, including non-disclosure states.
Nationally, the year-over-year home price changed by 4%. Connecticut was the only state to post an annual decline in home prices in January 2020.
The states with the highest increases year-over-year were Idaho (10.5%), South Dakota (9.3%) and Missouri (7.6%).
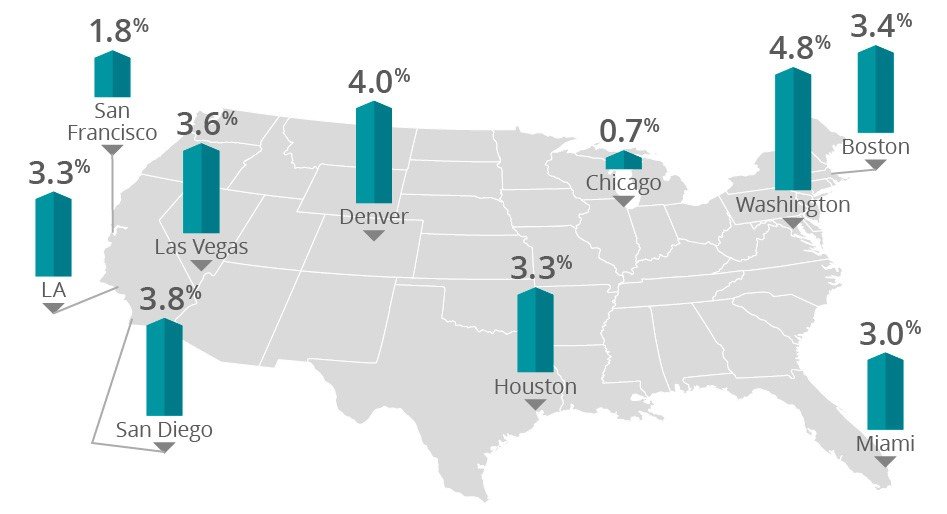
HPI Top 10 Metros Change
The CoreLogic HPI provides measures for multiple market segments, referred to as tiers, based on property type, price, time between sales, loan type (conforming vs. non-conforming) and distressed sales. Broad national coverage is available from the national level down to ZIP Code, including non-disclosure states.
These large cities continue to experience price increases, with Washington D.C. leading the way at 4.8% year over year.
Market Conditions Indicators (MCI) Metro Area Maps – January
2020
In an analysis of the country’s 100 largest metropolitan areas based on housing stock, 33% of cities have an overvalued housing stock as of January 2020, according to CoreLogic Market Conditions Indicators (MCI) data. The MCI analysis categorizes home prices in individual markets as undervalued, at value or overvalued by comparing home prices to their long-run, sustainable levels, which are supported by local market fundamentals such as disposable income. Also, as of January, 29% of the top 100 metropolitan areas were undervalued and 38% were at value. When looking at only the top 50 markets based on housing stock, 38% were overvalued, 24% were undervalued and 38% were at value. The MCI analysis defines an overvalued housing market as one in which home prices are at least 10% higher than the long-term, sustainable level, while an undervalued housing market is one in which home prices are at least 10% below the sustainable level.
Summary
CoreLogic HPI features deep, broad coverage, including non-disclosure state data. The index is built from industry-leading real-estate public record, servicing, and securities databases—including more than 40 years of repeat-sales transaction data—and all undergo strict pre-boarding assessment and normalization processes.
CoreLogic HPI and HPI Forecasts both provide multi-tier market evaluations based on price, time between sales, property type, loan type (conforming vs. non-conforming) and distressed sales, helping clients hone in on price movements in specific market segments.
Updated monthly, the index is the fastest home-price valuation information in the industry—complete home-price index datasets five weeks after month’s end. The Index is completely refreshed each month—all pricing history from 1976 to the current month—to provide the most up-to-date, accurate indication of home-price movements available.